 播面
播面 如何定位 React 应用中的性能瓶颈?
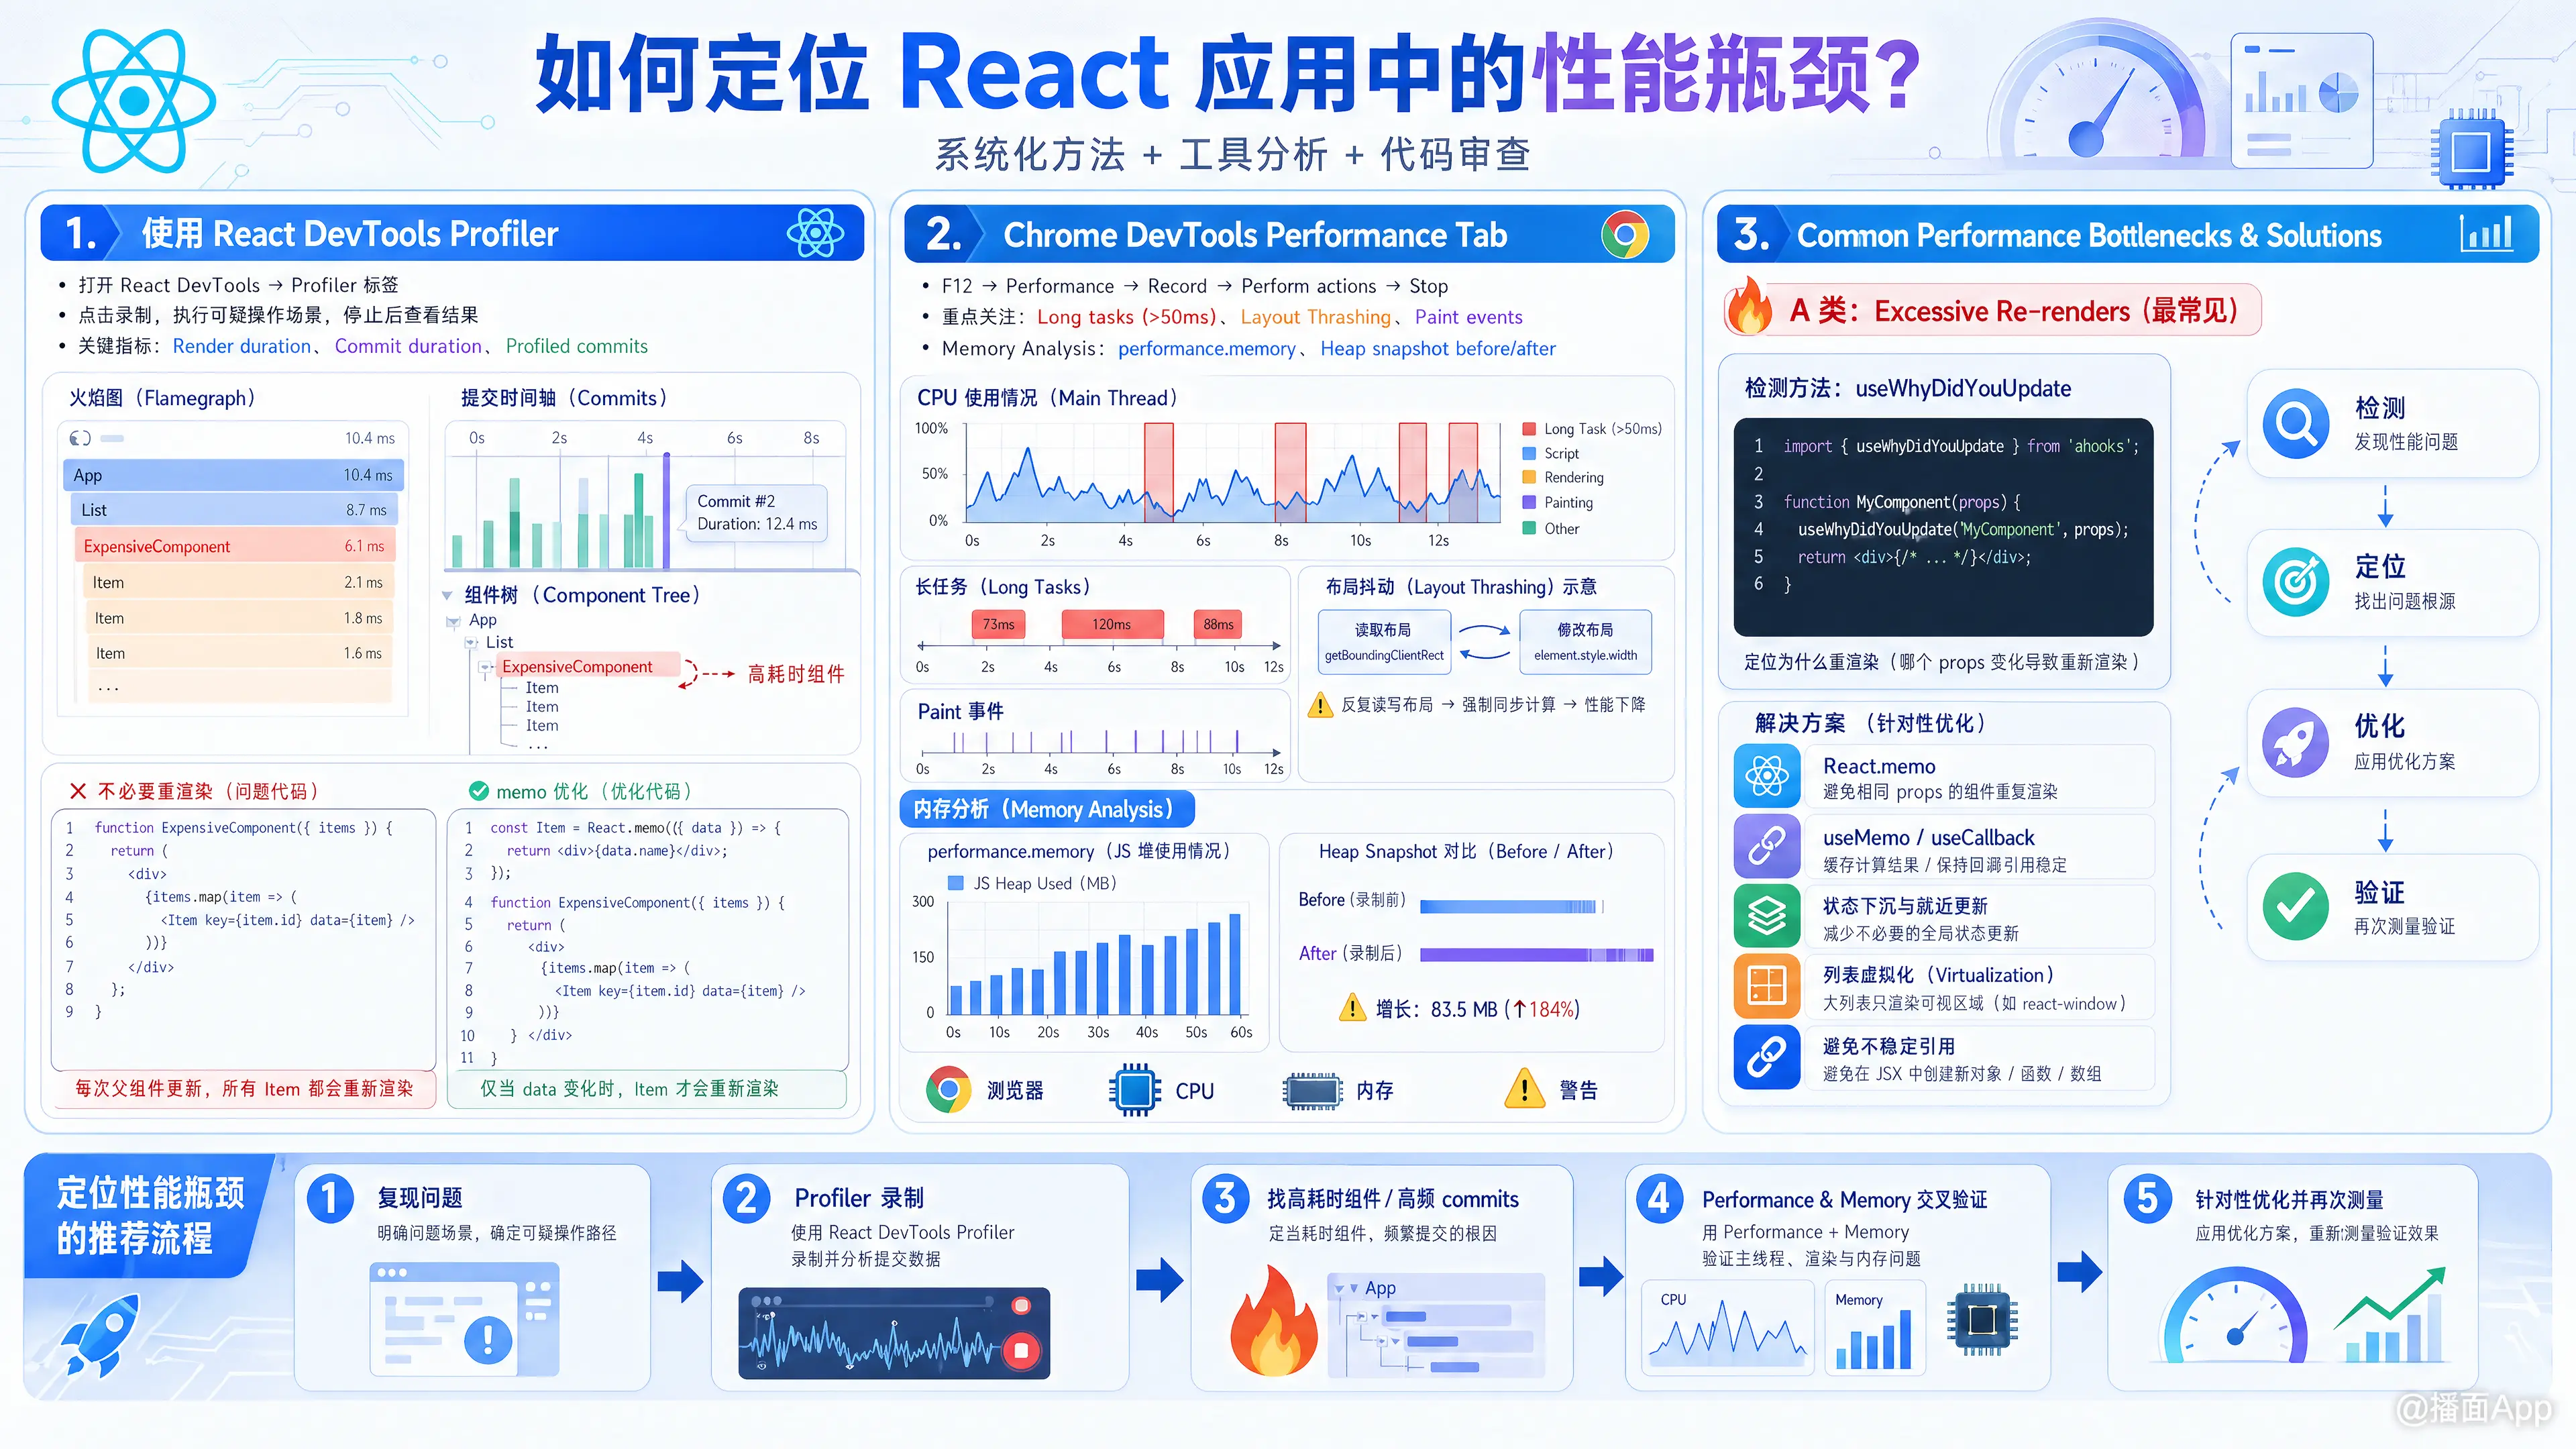
定位 React 应用中的性能瓶颈需要系统性的方法,结合工具分析和代码审查。以下是详细的步骤和常用工具:
1. 使用 React DevTools Profiler
安装和使用
# 安装 React Developer Tools
npm install -D @welldone-software/why-did-you-render
Profiler 分析步骤
记录组件渲染
- 打开 React DevTools → Profiler 标签
- 点击录制按钮开始记录用户操作
- 执行可疑的性能问题场景
- 停止录制查看结果
关键指标解读
- Render duration: 组件渲染耗时
- Commit duration: DOM 更新耗时
- Profiled commits: 提交次数(越少越好)
识别问题组件
jsx// Problematic component example const ExpensiveComponent = ({ items }) => { // ❌ Unnecessary re-renders when parent updates return ( <div> {items.map(item => ( <Item key={item.id} data={item} /> ))} </div> ); }; // ✅ Optimized with memoization const Item = React.memo(({ data }) => { return <div>{data.name}</div>; });
2. Chrome DevTools Performance Tab
CPU Profiling
- F12 → Performance → Record → Perform actions → Stop
- 重点关注:Long tasks (>50ms)、Layout Thrashing、Paint events
Memory Analysis
// Check for memory leaks in console:
console.log('Memory usage:', performance.memory);

// Heap snapshot comparison: before and after operations
3. Common Performance Bottlenecks & Solutions
A. Excessive Re-renders (最常见)
检测方法:
import { useWhyDidYouUpdate } from 'ahooks'; // or custom hook

const MyComponent = (props) => {
  useWhyDidYouUpdate('MyComponent', props);

  return <div>...</div>;

}; // Logs why component re-rendered and what changed}解决方案:
- React.memo for functional components
const MemoizedChild = React.memo(({ data, onClick }) => {
return <button onClick={onClick}>{data.value}</button>;
});

// Custom equality check if needed
const MemoizedWithCustomCheck = React.memo(
({ user }, prevProps) => user.id !== prevProps.user.id,
(prevProps, nextProps) => prevProps.user === nextProps.user); - shouldComponentUpdate for class components
class MyComponent extends Component {
shouldComponentUpdate(nextProps, nextState) {
return this.props.items.length !== nextProps.items.length; }
render() { /* ... */ }}- useCallback / useMemo hooks
function Parent({ list }) {
// ✅ Prevent function recreation on every render const handleClick = useCallback((id) => {
console.log(id);}, []);

// ✅ Prevent expensive calculation on every render const sortedList = useMemo(() =>
list.sort((a,b) => a.value-b.value), [list]);

return <ExpensiveChild items={sortedList} onClick={handleClick} />;
}
B. Large List Rendering Issues
虚拟滚动方案:
const BigList = ({ items }) => (
<List height={600} itemCount={items.length} itemSize={35}>
{({ index, style }) => (
<div style={{...style}}>{items[index].name}</div>
)}
</List> ); // Only renders visible items!}分页或无限加载:
<InfiniteScroll dataLength={items.length} next={()=>fetchMoreData()} hasMore={true}> {items.map(item=><ListItem key={item.id}{...item}/>)} </InfiniteScroll>C Bundle Size Problems
Webpack Bundle Analyzer:
检查并优化:
- Code splitting (
React.lazy+Suspense) - Tree shaking unused code
- Dynamic imports for heavy libraries:
Practical Debugging Workflow Example
Let's say you notice your app freezes during search filtering:
1️⃣ Use Profiler to record filter operation
→ See that SearchResults re-renders even when query unchanged
2️⃣ Check implementation:
❌ Problematic code:
Every time any prop changes in SearchPage causes fetchResults to run again!
✅ Fix with useMemo + debounce:
const debouncedQuery=useDebounce(query,300);
const results=useMemo(()=>fetchResults(debouncedQuery),[debouncedQuery]);
return<SearchResults results=results/>; }
Also wrap SearchResult child components with memo where appropriate.
By following these steps systematically—starting broad with profiling tools then drilling down into specific patterns like unnecessary renders or large computations—you can effectively identify and resolve most common performance issues in React applications while maintaining clean maintainable codebase practices throughout optimization efforts!